
Blog
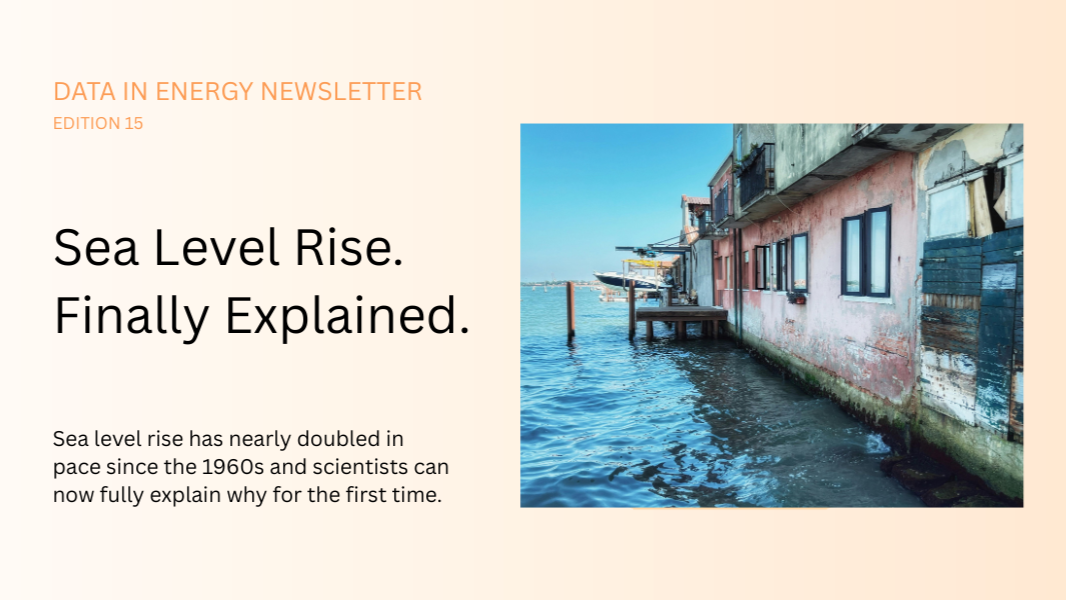
Sea Level Rise. Finally Explained
The best questions are not always the comfortable ones. Like: if scientists have spent sixty years trying to fully explain why sea levels are rising and have only just closed the measurement gap, what does that tell us about the planning decisions made on the old numbers? And if warm ocean water has been silently moving toward Antarctica's ice shelves for two decades but only became visible when monitoring infrastructure finally caught up, how many other shifts are already underway that the data systems have not yet seen?
Two studies published in the past six weeks have produced findings that deserve far more attention than they have received. One closes a long-standing measurement problem that had limited confidence in sea level projections. The other reveals a process in the deep ocean that models predicted but data could not confirm until now. Both are, at their core, data infrastructure stories. What the monitoring systems could not see before, what they can see now, and what the gap between those two things means for the decisions being made on top of them.
The Sixty-Year Measurement Gap Is Closed
For decades, climate scientists faced a frustrating problem. The oceans were observed to be rising. The known physical causes, warming water expanding, glaciers melting, ice sheets losing mass, added up to less than what the measurements showed. The gap was small but persistent, and it mattered enormously for confidence in sea level projections. If the models could not fully account for past rise, how reliable were their projections of future rise?
A new international study published in Science Advances in May 2026 has now closed that gap. Researchers assembled 63 years of ocean observations, combining ship-based survey records with data from the global Argo float network, a system of roughly 4,000 autonomous instruments drifting through the ocean and transmitting data in real time. The result is the most complete accounting of global sea level rise ever assembled (source: ScienceDaily / Science Advances).
The oceans have risen nearly 10 centimetres since 1960, and the rate is now almost double what it was six decades ago. Global mean sea level rise across the full 1960 to 2023 period sits at 2.06 millimetres per year, accelerating to 3.41 millimetres per year during the satellite era from 1993 to 2023, and reaching 3.94 millimetres per year between 2005 and 2023.
Since 1960, 43% of global sea level rise is attributable to thermal expansion of warming seawater. Mountain glaciers account for 27%, the Greenland Ice Sheet contributes 15%, the Antarctic Ice Sheet contributes 12%, and changes in land water storage make up the remaining 3%. The scientists also found that the dominant drivers have shifted over time. Earlier in the record, ocean warming was the primary factor. Since the 1990s, accelerating ice loss from glaciers and the Greenland and Antarctic ice sheets has become a much larger contributor.
The significance of closing the measurement gap is not just scientific. "For years, there has been a frustrating gap between how much the oceans were observed to be rising and how much we could explain from the individual causes," said John Abraham, an engineer at the University of St. Thomas and a coauthor of the research. "This work shows that, with better instruments, processes, and smarter analysis, this knowledge gap can be closed. We can explain sea level rise with greater confidence."
Greater confidence in the explanation means greater confidence in the projection. An acceleration of 0.71 millimetres per year per decade means that by 2033 the annual rise will be higher than it is now, and higher again by 2043. Those figures are what coastal planners, flood insurers, and infrastructure engineers are now working from.
The Data Infrastructure Story Inside the Finding
The closure of the measurement gap is not only a scientific achievement. It is a data infrastructure achievement. The Argo float network, which made the continuous deep-ocean temperature and salinity measurements possible, was not deployed until the early 2000s. Before that, the Southern Ocean and deep ocean basins were measured by research ships on roughly ten-year intervals, producing detailed snapshots with enormous gaps between them.
Historically, scientists relied on ship-based surveys of the Southern Ocean which were typically conducted about once every ten years and provided detailed snapshots of temperature, salinity and nutrient levels. However, the gaps between measurements made it difficult to track long-term changes in how heat moves through the ocean.
The sixty-year measurement problem was not solved by better physics. It was solved by better instrumentation deployed continuously over two decades. The data that closed the gap did not exist until someone built the infrastructure to collect it. That investment in monitoring is now returning decades of scientific clarity that ship-based surveys alone could never have produced.
The implication for the broader data argument this newsletter has been making since March is direct. The sea level measurement gap was a known unknown for decades. Scientists documented it, flagged it, and eventually built the infrastructure to close it. The same pattern applies to every data gap this series has covered, from fertilizer price lags to battery supply chain opacity to water stress monitoring to climate perception gaps. The gap is identifiable. The infrastructure to close it is buildable. The decision to build it is political and financial, not technical.
The Heat That Was Already Moving
The sea level story has a companion finding that arrived in the same research cycle and has received even less attention. A major new study drawing on decades of ocean data has found clear evidence that heat from the deep ocean is shifting toward Antarctica. This change poses a growing threat to the continent's delicate ice shelves, which line its coast and help stabilise the ice sheet.
Researchers led by the University of Cambridge, working with colleagues from the University of California, found that a large body of relatively warm water known as circumpolar deep water has expanded and gradually moved closer to the Antarctic continental shelf over the past two decades. "This isn't just a possible future scenario suggested by models. It's something that is happening now, bringing wider implications for how carbon, nutrients, and heat are cycled through the global ocean."
The finding matters because of what Antarctic ice shelves do. Ice shelves are giant floating extensions of glaciers that help slow the movement of massive amounts of ice into the ocean. If they become thinner and less stable, the glaciers behind them may flow into the sea more quickly, speeding up global sea level rise well beyond many current estimates. Antarctic ice shelves collectively hold enough freshwater to raise sea level by about 58 meters.
A separate study published in Nature Communications in May 2026 found that the threat is more acute than previously understood. Researchers identified channel-like formations beneath ice shelves that can trap relatively warm seawater, dramatically increasing melting in specific areas. The study found that even modest inflows of warmer deep water were enough to sharply increase melting inside the channels beneath the Fimbulisen Ice Shelf in East Antarctica, a region previously considered cold and more stable than the western side of the continent.
Until now, scientists lacked enough continuous data to confirm this warming trend. "It's concerning, because this warm water can flow beneath Antarctic ice shelves, melting them from below and destabilising them," said Joshua Lanham, lead author of the study at Cambridge Earth Sciences. "It's something that had been predicted by climate models due to global warming, but we hadn't seen it in data."
That last sentence is the one worth pausing on. The models predicted it. The data to confirm it did not exist until researchers combined ship-based records with the Argo float network across a twenty-year window. The heat was already moving. The monitoring infrastructure to see it moving took two decades to build.
What Both Findings Have in Common
The sea level attribution study and the Antarctic ocean heat study are, at their core, the same story told twice. In both cases, a physical process was underway for decades before the data infrastructure existed to make it visible. In both cases, the finding required combining multiple data sources collected over long periods at significant cost. In both cases, the confirmation arrived later than the process it was confirming.
This is the central data infrastructure problem in climate science and it applies well beyond these two studies. The systems being monitored are changing faster than the monitoring infrastructure was designed to track. Ship surveys every ten years are not adequate for an ocean that is warming continuously. Static coastal tide gauges are not adequate for a sea level that is accelerating. Ground-based weather stations are not adequate for a climate system that is shifting at the pace the satellite record now documents.
The Argo float network is one of the best examples of what happens when the monitoring infrastructure catches up. Deployed continuously since the early 2000s, it has transformed deep ocean science by providing the kind of continuous, global, real-time data that ship surveys could never deliver. The question is whether the same investment in continuous monitoring is being made in the other systems where the gaps are now known: ice shelf dynamics, groundwater depletion, biodiversity loss, atmospheric methane from thawing permafrost.
The Planning Gap Underneath the Science Gap
Both studies have direct and immediate implications for infrastructure planning, insurance pricing, and coastal investment that are not yet reflected in the data systems those sectors depend on.
The rate of sea level rise has nearly doubled inside a single lifetime and it is not a projection. The full 63-year dataset now matches what known physical sources actually deliver to the ocean. Coastal flood insurance models, municipal infrastructure planning timelines, and mortgage risk assessments for coastal properties are all calibrated to projections that predate this confirmation. The data that should update those models now exists. The frameworks to translate new scientific findings into revised planning assumptions in real time do not.
The Antarctic ocean heat finding compounds this. If ice shelf instability in East Antarctica is more sensitive to warm water intrusion than models assumed, the upper end of sea level rise projections moves upward. The infrastructure planning decisions being made today, for ports, for coastal cities, for flood barriers, for energy assets in coastal regions, are being made on a risk envelope that the latest data suggests is too narrow.
This is the same pattern the insurance edition of this newsletter documented in April. The models are not wrong. They are calibrated to data that is now out of date. And the gap between what the science shows and what the planning frameworks reflect is widening at exactly the moment when coastal exposure is growing.
The Path Forward
The closure of the sixty-year sea level measurement gap is a genuine achievement and a model for what data infrastructure investment can deliver. The Argo float network took decades of international cooperation and sustained funding to build. Its payoff is scientific certainty about a process that had been frustratingly opaque since satellite measurement began.
The same investment logic applies to the monitoring gaps that remain. Continuous ice shelf thickness measurements. Real-time deep ocean temperature at the Antarctic continental shelf. Standardised global coastal flood risk datasets that are updated as the science improves rather than on five-year review cycles. These are not aspirational data systems. They are the minimum infrastructure needed to make rational planning decisions in a climate that is changing at the pace the record now documents.
The ocean already knew. The question is whether the planning systems can catch up before the gap between what the data shows and what the decisions assume becomes unbridgeable.
Sources:
- ScienceDaily: Sea Level Rise Is Speeding Up and Scientists Now Know Exactly Why
- SciTechDaily: Scientists Just Confirmed What Is Driving Sea Level Rise
- Eos: Sea Level Rise Is Accelerating, Scientists Confirm
- Above the Norm News: Sea Level Rose Nearly 10cm Since 1960
- ScienceDaily: Hidden Ocean Heat Is Creeping Toward Antarctica's Fragile Ice Shelves
- Phys.org: Deep-Ocean Heat Has Been Marching Closer to Antarctica
- SciTechDaily: Hidden Warm Water Beneath Antarctica Could Rapidly Raise Global Sea Levels
- Nature World News: Hidden Ocean Heat and Circumpolar Deep Water Are Threatening Antarctica
- Phys.org: Antarctica's Ice Shelves Are Vulnerable to Melting From Below
Want to contribute your thoughts or findings in data and AI with climate, energy, or nature? Message Jan Gunash on LinkedIn or send an email to jgunash@projectcoeus.com.