Blog
Water Bankruptcy
The best questions are not always the comfortable ones. Like: when we say the water crisis is getting worse, what exactly are we measuring? And when the institutions responsible for managing that crisis are working from data systems that do not reflect how water actually moves, what does that mean for every decision built on top of them?
These are not hypothetical questions. The water crisis has a new name this year, a more accurate one, and a set of live examples that show what it looks like when the data arrives too late to change the outcome.
A New Word for an Old Problem
In January 2026, the United Nations University Institute for Water, Environment and Health published a flagship report ahead of the 2026 UN Water Conference with a title that deserves attention: Global Water Bankruptcy: Living Beyond Our Hydrological Means in the Post-Crisis Era. The report argues that the term water crisis is no longer sufficient to describe what is happening to global water systems (source: UNU-INWEH). The word crisis implies a temporary shock that can be resolved. What is happening to river basins and aquifers across the world is structural and in many cases permanent. More and more water systems are losing the ability to return to their historical normal. Droughts, shortages, and pollution episodes that once looked like temporary disruptions are becoming the baseline condition.
The UN framing matters because it changes what the data needs to do. A crisis requires an emergency response. Bankruptcy requires restructuring. The monitoring systems, governance frameworks, and data infrastructure being used to manage global water were built for a crisis model. They are being asked to operate in a bankruptcy model without being redesigned for it.
The World Bank warns that global freshwater demand could exceed supply by 40% before 2030, with climate change disrupting rainfall patterns and intensifying both droughts and floods. That number sits behind most water risk headlines. What sits beneath it is a data problem that almost nobody is talking about. All About AI
What the Data Actually Shows
To understand the scale of what is coming, we ran an original analysis on Panthaion using the WRI Aqueduct Projections dataset, covering over 5,000 river basins globally. Rather than looking at water stress alone, we built a Compounding Risk Score combining three dimensions: water stress, which drives the headline numbers, weighted at 50%; seasonal variability, which determines whether water that exists is reliably accessible, weighted at 30%; and drought severity, which measures how hard the recovery window is being compressed, weighted at 20%.
The result is a more honest picture of water risk than any single indicator provides.
Today, roughly 14% of global watersheds already sit in the severe or critical risk tiers. That share grows to 17% by the 2040s under the trend scenario. The shift looks modest in percentage terms. It is not modest in consequence. The basins moving from high to severe risk are the ones where the combination of stress, variability, and drought is crossing from manageable to structural. They are the Corpus Christis and Mexico Cities of the next decade, except most of them have not yet made the news.
The moderate risk tier, which currently holds 53% of global watersheds, is also shrinking. Not because those basins are recovering but because they are escalating. The green at the bottom of the chart is not growing. The red and orange at the top are.
What Water Bankruptcy Looks Like on the Ground
Corpus Christi, Texas is not a city that features prominently in global water discussions. It probably should. As of early 2026, Lake Corpus Christi stands at just over 9% of capacity, and Choke Canyon Reservoir, the city's other primary source, is below 8% full. City planning scenarios suggest a formal Level 1 water emergency could be declared as early as May. Some city planning models now account for no meaningful rainfall for the remainder of the year, not as a worst case, but as a planning baseline. Carbon Credits
That last detail is the one that matters most for the data argument. When no rainfall becomes the planning baseline rather than the extreme scenario, the historical datasets that underpin water management planning are no longer useful. The models trained on past rainfall patterns are projecting forward into conditions those patterns cannot describe.
This is not a failure of prediction. The science has been consistent for decades. It is a failure of alignment. The climate is changing faster than the infrastructure built to manage it. Petrochemical plants, steel mills, and LNG export facilities came to the Corpus Christi region with assurances that water would be available. Those assurances were made against a rainfall baseline that the drought has since revised. What was promised as an abundant water supply was water that depended on hydrological conditions that did not persist. Carbon Credits
This is the water equivalent of the insurance model problem examined in this newsletter four weeks ago. The data used to make the commitment described a climate that no longer exists.
A City Sinking Into Its Own Aquifer
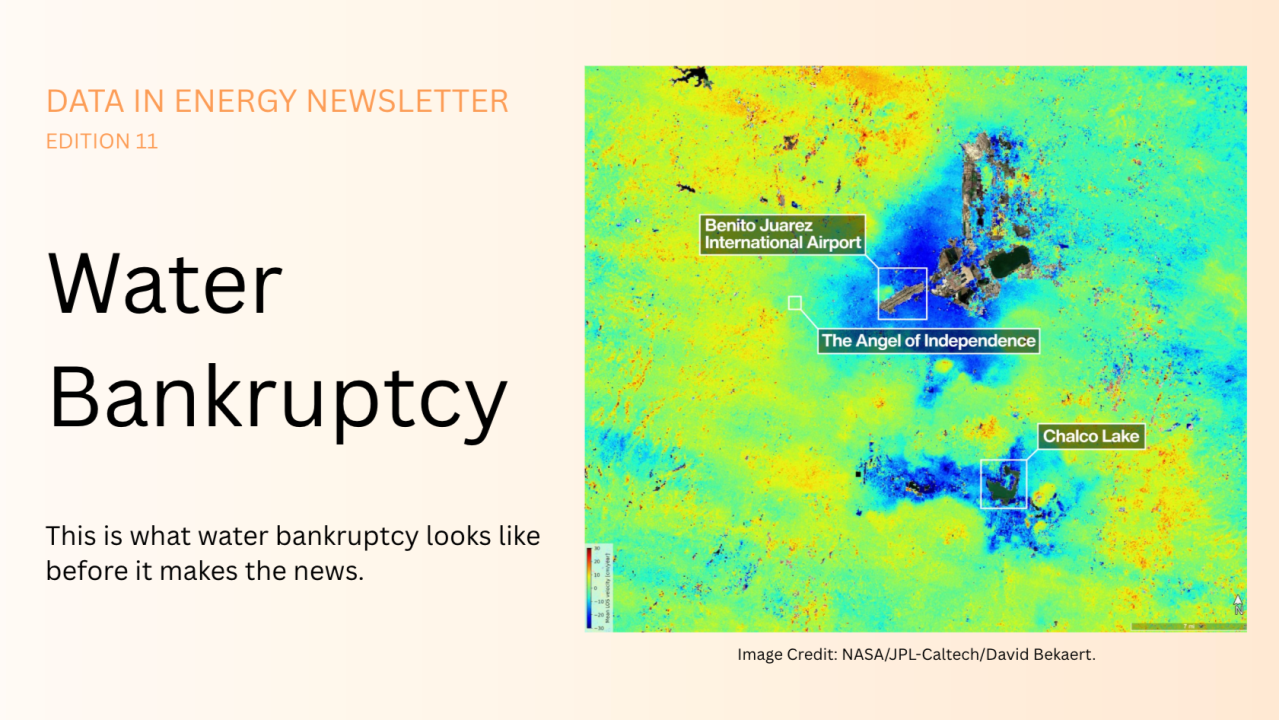
Mexico City is the most dramatic current illustration of what happens when groundwater withdrawal consistently outpaces replenishment over decades. New imagery from NASA's NISAR satellite shows parts of Mexico City subsiding by roughly 0.8 inches per month between October 2025 and January 2026, fracturing roads, buildings, and water lines. The city has been sinking since the 1920s, when large-scale aquifer extraction began. What is new is the resolution of the data. NISAR is one of the most powerful radar systems ever launched, and it is making the invisible visible in ways that ground-level monitoring never could. Calvert
The data is extraordinary. The governance response to it is not keeping pace. Mexico City has known about its subsidence problem for a century. The NISAR imagery provides unprecedented detail about exactly where and how fast different parts of the city are sinking. But detailed data about a problem that has been knowingly unaddressed for decades does not automatically produce a policy response. The data gap and the governance gap are two different problems, and solving the first does not solve the second.
Water as a Conflict Driver
The Middle East conflict has dominated energy coverage for the past three months. The water dimension of geopolitical instability is receiving almost no attention relative to its significance. In 2024, the last full year for which data is available, there were a record 420 water-related conflicts globally, according to the Pacific Institute. The institute's Water Conflict Chronology has recorded more than 2,750 instances of water and water systems being used as a trigger, target, or weapon of violence over the past several thousand years. IAEA
The acceleration matters. The Pacific Institute data shows the number of water conflicts roughly doubling every decade since the 1980s. The African Union's annual summit in February 2026 focused specifically on sustainable water management as the continent faces a growing scarcity crisis (source: CFR). The Nile Basin tensions between Ethiopia, Sudan, and Egypt over the Grand Ethiopian Renaissance Dam remain unresolved and are intensifying as downstream water availability declines. Water conflict is not a future risk. It is a present trend that is accelerating, with data to show it, and almost no international governance framework designed to manage it at the scale required.
The Data Infrastructure That Was Never Built
The governance failure underneath all of these stories has a data infrastructure component that is specific and actionable. A 2026 Stanford Water in the West conference found that sensor networks deployed across the San Joaquin Valley reveal that groundwater sustainability agency boundaries do not reflect how water actually moves underground. The monitoring infrastructure exists. It is pointed at the wrong boundaries. The governance structures managing California's groundwater were drawn around political and administrative lines, not hydrological ones. The data generated within those boundaries cannot tell you what is happening to the water system as a whole. I2sc
This is a precise version of the same problem that has appeared in every newsletter in this series. In weather forecasting, AI models trained on data-sparse regions inherit the biases of the physics models that filled the gaps. In critical minerals, supply chain data is tracked by commercial contracts rather than public registries. In fertilizer markets, production figures lag by months in a market where timing determines whether a crop gets planted. In water, the sensor networks and governance agencies responsible for monitoring one of the most fundamental resources on earth are misaligned with the physical reality they are supposed to describe.
Our Panthaion analysis makes this visible at the global level. The compounding risk methodology surfaces something a single-indicator analysis misses: the basins moving fastest toward bankruptcy are not necessarily the ones with the highest water stress today. They are the ones where stress, variability, and drought are escalating simultaneously, compounding each other in ways that no single monitoring framework currently captures.
The Path Forward
Water bankruptcy is a useful frame precisely because it implies a different kind of response than crisis management. Bankruptcy requires an honest accounting of assets and liabilities, a restructuring of obligations to match actual capacity, and a governance process that is transparent about what can and cannot be repaid.
For water systems the honest accounting starts with data. Which aquifers are in structural deficit and cannot recover under any realistic management scenario? Which river basins are being committed to users at volumes that rainfall projections no longer support? Which cities are making infrastructure and industrial investment decisions based on water availability assumptions that the data already contradicts?
The answers to those questions exist in satellite imagery, groundwater monitoring networks, and climate projections. They are not being systematically assembled, shared, or used to constrain the commitments being made above them. Corpus Christi's reservoirs did not reach 9% capacity without warning. They reached it with decades of consistent scientific warning and insufficient governance response.
The water the world depends on is measurable. The gap between what is being measured and what is being acted on is the crisis. Calling it bankruptcy is a start. Building the data infrastructure that makes an honest accounting possible is the work.
Sources:
- UNU-INWEH: Global Water Bankruptcy — Living Beyond Our Hydrological Means
- Council on Foreign Relations: The Global Water Crisis — Stress, Scarcity, and Conflict
- CNN / NASA NISAR: Mexico City Sinking — New Satellite Imagery
- Texas Observer: The Corpus Christi Water Crisis Is Not Exceptional. It Is Early.
- Stanford Report: The American West's Water Crisis Has a Governance Problem
- World Economic Forum: Cities on the Frontline of the Water Crisis
- Pacific Institute: Water Conflict Chronology
- WRI Aqueduct: Global Water Risk Projections Dataset
Want to contribute your thoughts or findings in data and AI with climate, energy, or nature? Message Jan Gunash on LinkedIn or send an email to jgunash@projectcoeus.com.